Contact information.
-
Address"Ekzarh Yosif" street, 31, 1000 Sofia, Bulgaria
-
Phone:+359 2 980 95 99
-
Websitewww.balkanservices.com
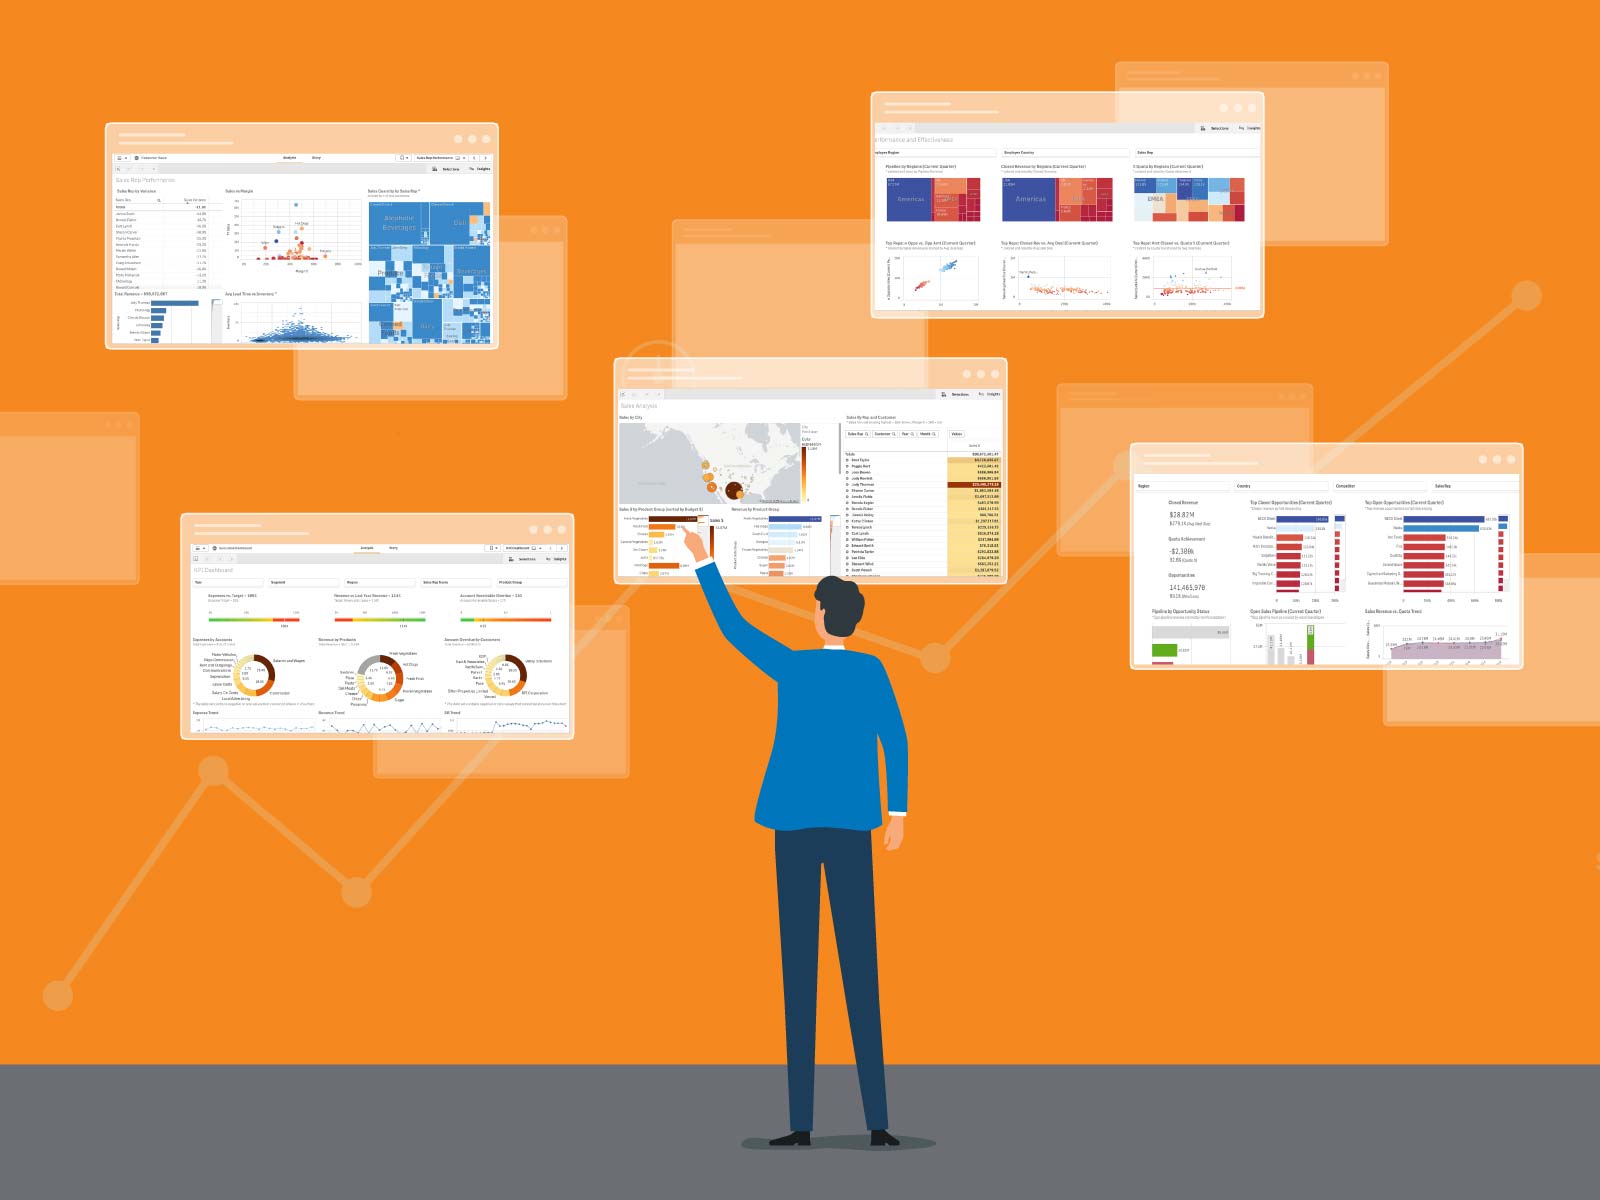
Business intelligence systems (BI systems) are a set of software tools that aggregate, unify, analyze and visualize data from a variety of internal and external company sources. Business Intelligence software organizes information according to certain patterns and trends, presented as reports, dashboards, and visualizations.
BI solutions find application in any organization seeking better visibility, traceability and accountability.
From our years of experience in implementing BI systems, we are convinced that one of the areas that most often benefits from the capabilities of business intelligence platforms is sales.
These are just some of the questions companies can answer with just a few clicks in the BI system. In this article, we will present examples, templates and practical tips to help sales executives create the best sales dashboards in the company to effectively manage sales processes.
Read more: Business Intelligence software- what, for whom and why
A sales dashboard is a BI tool that allows sales teams to track and analyze key performance indicators and share this information across the organization.
Modern sales dashboards go beyond simple visualization. They integrate with ERP systems, CRM, marketing and financial systems, allowing for easy data entry and reliable and timely information. This helps to forecast more accurately, close more deals, and achieve the organization’s business revenue goals.
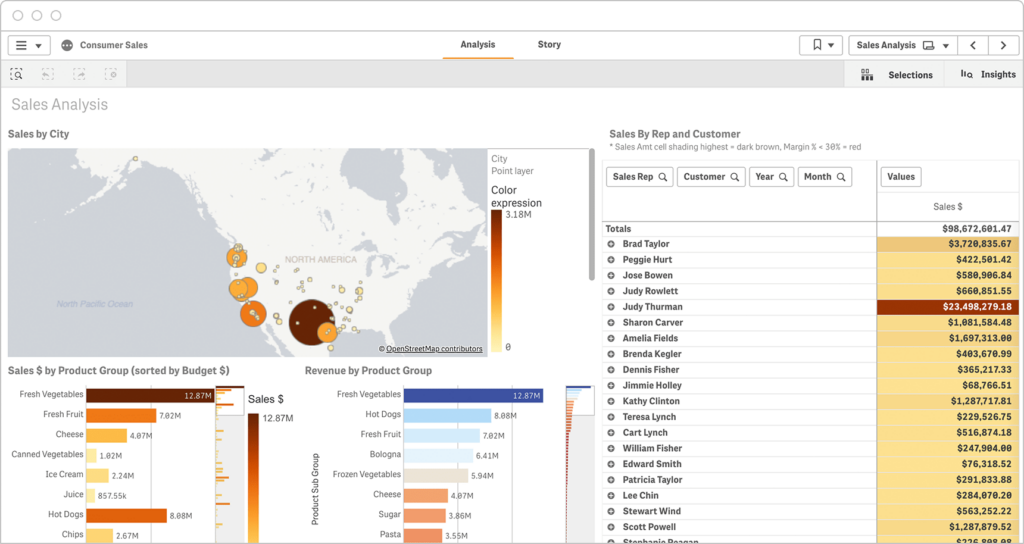
Dashboard from the BI system Qlik Sense
Read more: The 10 most important metrics for every sales manager and how to track them effectively
Effective sales management dashboards allow sales teams to easily track their progress against goals, manage sales funnels, identify challenges, and make predictions based on reliable data.
Sales managers and directors are essential figures in any organization, and the sample dashboards described below help them quickly present results to all stakeholders.
Dashboard from the BI system Qlik Sense
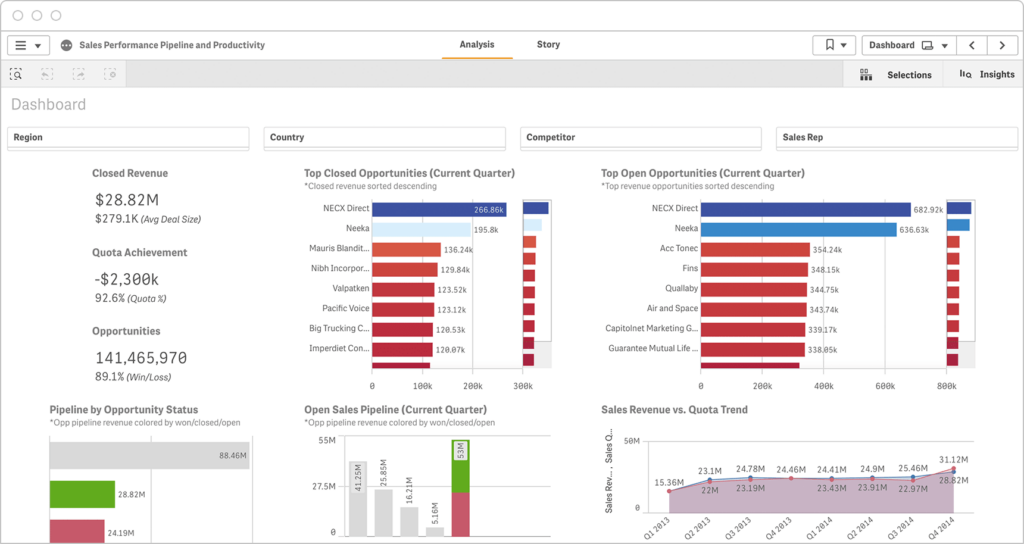
Executives need to quickly assess and share key performance indicators (KPIs) for sales, such as new deal revenue, open opportunity status, performance trends against targets, and TOP closed and open opportunity deals in the current quarter.
Dashboard from the BI system Qlik Sense
Read more: 5 Benefits for Companies of Working with a Business Intelligence System
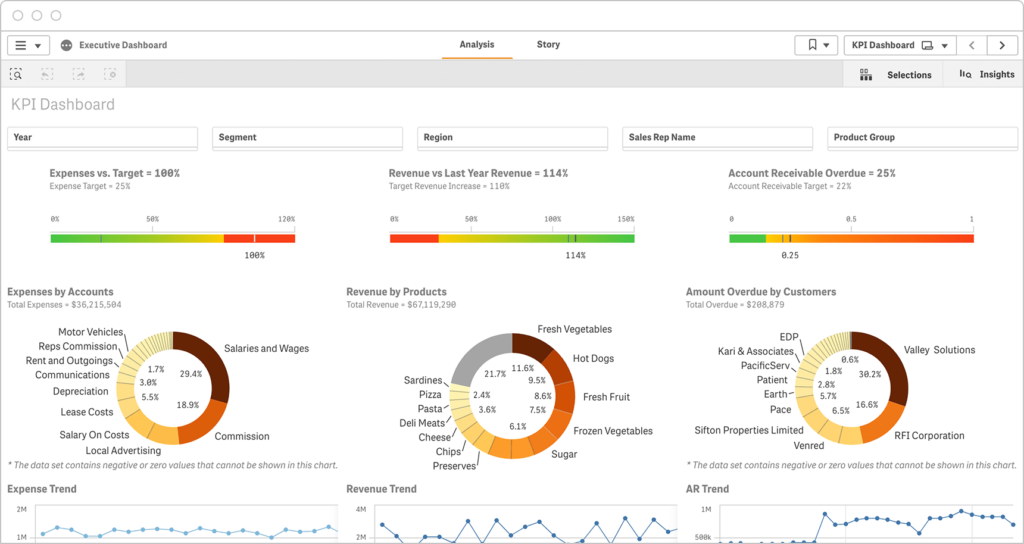
Sales departments naturally track revenue, but it’s also essential to track management metrics such as cost to reach goals and accounts receivable percentage. It would be good to have the ability to compare data by year, segment, region, sales rep and product group.
Modern BI systems integrate data from different sources to present these key performance indicators in one place.
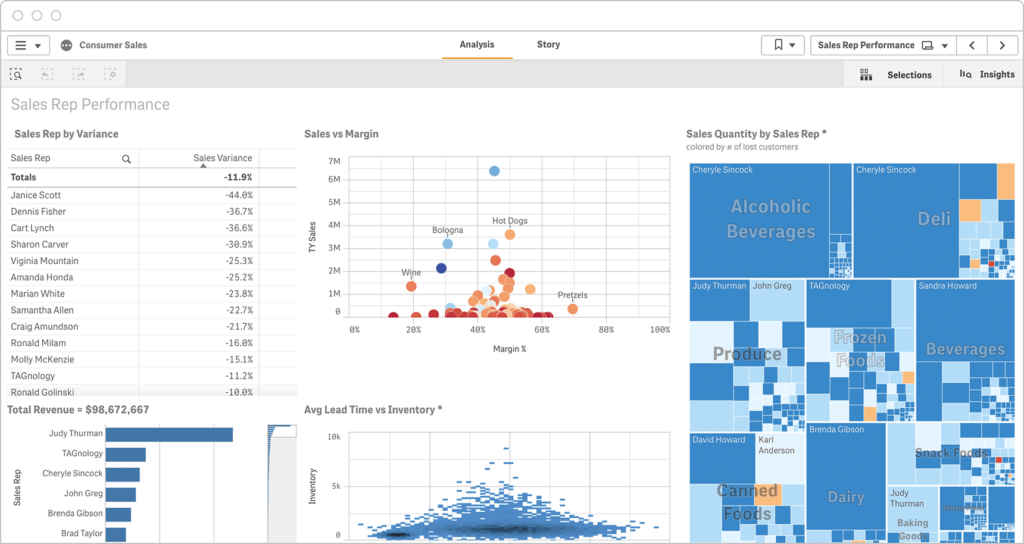
Dashboard from the BI system Qlik Sense
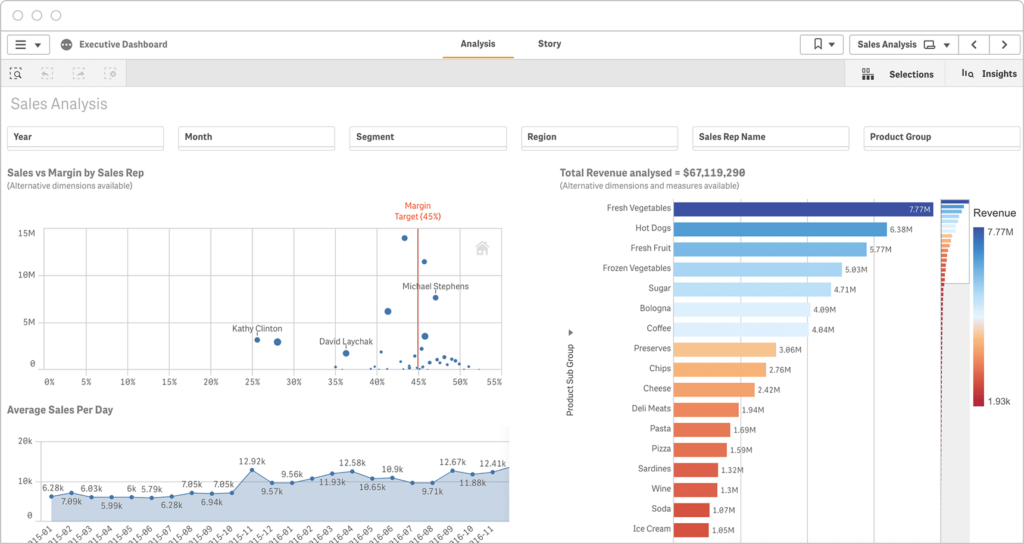
Sales managers are also responsible for profitability, not just sales revenue. This sales analytics dashboard presents a comprehensive visualization of the actual sales versus margin, broken down by salesperson, and allows stakeholders to drill down into the performance of each sales department member.
Примерен дашборд в Business Intelligence системата Qlik Sense
Read more: From QlikView to Qlik Sense: the migration of TESY to a new generation of BI [case study]
Our team is here to listen carefully and offer the right solution for you.

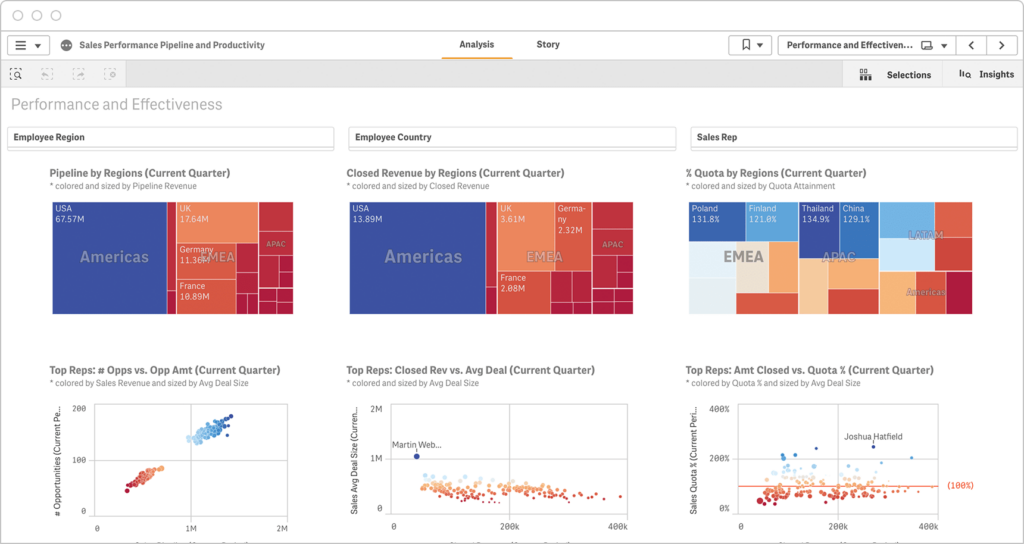
Salespeople need a dashboard that gives a complete picture of sales – from the macro level to individual-level performance, all on one screen. This example dashboard allows easy drilling into the data to analyze the state of the sales funnel by region, industry, job function or sales rep.
Примерен дашборд в Business Intelligence системата Qlik Sense
Choosing the right software system for your company is a complex but critically important decision for business development. Choosing an implementation partner is just as key and sometimes more difficult.
At Balkan Services, we have expert knowledge of business, technology and legislation, and we speak all three languages. We will listen carefully and advise you on choosing the right business system for your needs.
Balkan Services has been implementing business software solutions since 2006 and has completed more than 720 projects, of which over 440 are in the area of BI systems. We follow a proven implementation methodology with clear steps and know-how on best practices.